The Traction Zone: A Visual Representation of Available Traction

As motorcycle riders we all know very well that there is a limit placed on the amount of available traction we have during riding.
We also know that if you happen to stray past that limit then the consequences are often not so good, unless of course you have the necessary skills to deal with it, or you’re just really lucky.
However, while we know that the limit is there and we don’t want to exceed it, for many it will feel like some vague area that they aren’t really familiar with and don’t know at what point it exists.
To combat this lack of clarity and give riders an idea of what the traction limit looks like, there is a commonly used visual representation of the traction zone (also known as the traction circle) that demonstrates how we can best use available traction.
What is it?

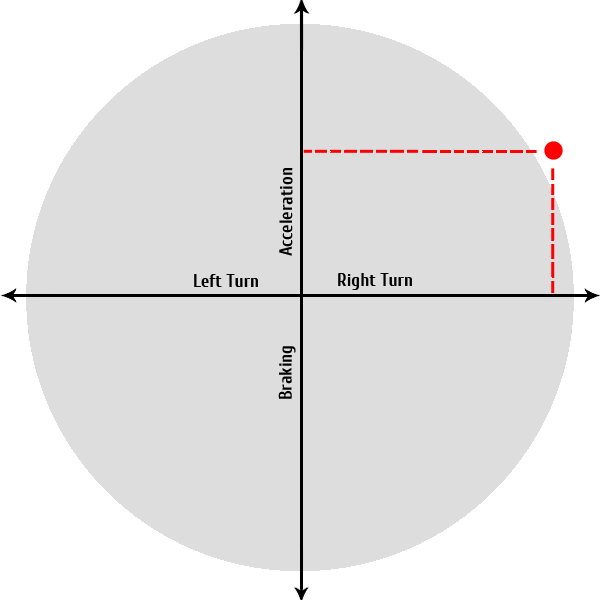
As the picture to the right shows, the traction circle is shown as a simple graph, with traction being shown as the accelerative force acting against you, the bike and the tyres in every direction.
Now, for a lot of people the only known definition of acceleration will be the 0-60 time of their bike or car, but here we are talking about the measurement of acceleration felt as weight – known as g-force, or G for short.
So just like when accelerating in a straight line, you are also experiencing this accelerative force (g-force) during braking and turning too. This common relationship handily allows us to plot these accelerative forces on the same graph.
The maximum G figure is still debated today, but for the sake of simplicity let’s say that the maximum accelerative force that can be applied in any direction to a well sorted race bike with sticky rubber will be 1.5G. In this case, 1.5G will represent the outer limit of the circle on the graph.
(Just to note, MotoGP bikes are said to hit 1.6G in the corners, and up to around 1.5 – 1.8G in the heaviest braking zones)
Using the graph

For example then, if you imagine being hard on the power in the straight line on a 1000cc bike, you would find yourself plotted on the graph near the top of the vertical line. Similarly, braking hard in a straight line would be plotted near the bottom of that same axis.
At maximum lean in a right hand turn, as you would expect, you would see yourself plotted out to the right hand edge of the circle on the horizontal line.
It’s really only once you start using a combination of acceleration or braking with turning that you’ll see the point come away from either axis on the graph.
The picture above shows what the graph would look like if you were at moderate lean to the right and applying moderate acceleration at the same time.
Looking at this representation then you can quickly see what it is that causes riders loose traction. Imagine another rider at maximum lean in a right hand turn, the graph to the right shows exactly what happens when they get too greedy with the throttle mid turn.
They step out of the traction zone because they’re asking the tyres to deal with too much accelerative force.
Equally, the same would happen on the entrance to a corner.
If you’re hard on the brakes in a straight line and you try to turn, thereby adding lateral g-force to the tyre, this will more than likely exceed that 1.5G limit and again, you would lose traction.
It’s clear then that your job as a rider is to make sure that you stay within this traction zone at all times by keeping the force acting against the tyres under that maximum 1.5G.
Even if this does seem incredibly obvious to you (don’t apply too much power at high lean etc), I think a visual representation like this gives you a good mental picture of what’s happening while out on track, and it’s good to concentrate on the total of all forces we place on our tyres, rather than breaking up acceleration, braking and turning into separate things to concentrate on.
Looking at it this way will also improve how you spend your concentration. As you exit a corner where most of your attention would have been feeling available side grip, as you pick the bike up and move yourself away from the horizontal axis of turning, your concentration will shift to feeling for grip as you apply your exit power.
If you want to get the most out of you and your bike, evaluate one of your laps and ask yourself if there are clear points where you are not near that maximum 1.5G limit of your traction zone. For example if your bike is upright and you’re not accelerating or braking, you’re coasting, thereby not using all available traction.
As you become a better track rider and you get faster you will be spending more time near the outer boundaries of the circle, and staying near the outer reaches of the zone will yield greater results in the way of lap times. That is essentially why top level racers are as fast as they are, because they can go near (and sometimes a little past) the limits of traction and stay there consistently.
Side note: The shape of your traction zone will never be a perfect circle because different capacity bikes will outperform others in different areas. Also it has been shown in various data acquisition tests that some bikes can accelerate harder at slight lean as opposed to sitting vertically.
This will largely be down to the fact you’re sitting on a part of the tyre that has a smaller diameter (effectively shortening the gearing), and because the contact patch is bigger at slight lean angles vs upright when using race tyres.
Related Posts
How to Tackle Hairpin Corners on the Track
Body Position: What the Bike Wants From You As a Rider
How to Get the Most from Your Track Time: Pre-Ride Prep & How to Approach Your Day
How to Deal With the Panic When Someone Takes Your Line